Distribution or Rotation? Reading Capital Flows Beneath a Record Tape
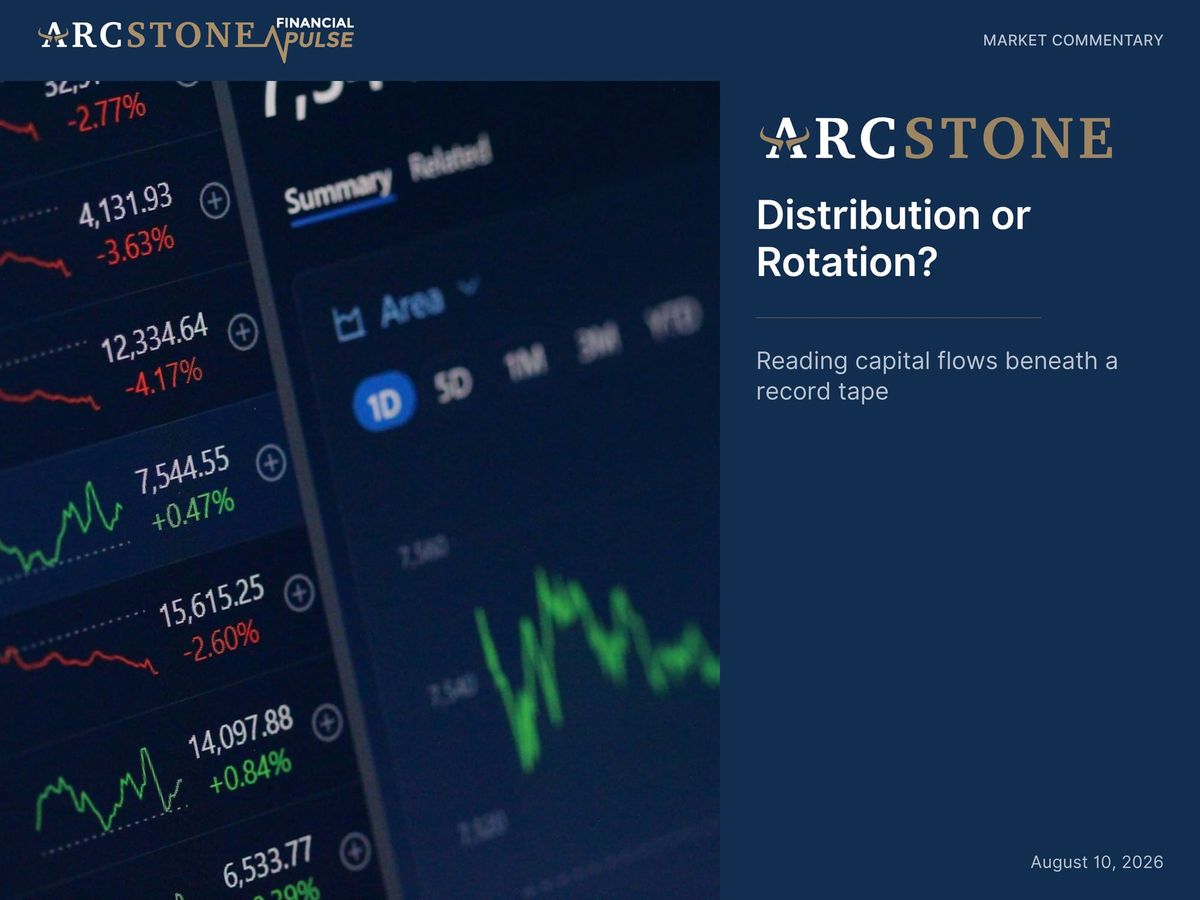
ArcStone Financial Pulse · Market and Industry Update · August 10, 2026
This is a general market and industry update. It does not analyze, value, or make recommendations regarding the securities of any issuer, and it does not offer a view on any individual company's shares. Companies are named only where reporting their own publicly disclosed figures.
The S&P 500 and the Dow have both printed records this year while the semiconductor complex, the Nasdaq 100 and the market's single largest name have not. This update examines whether that gap is capital rotating between leadership groups inside a market that is still working, or capital beginning to leave.
At a Glance
| Signal | Reading | Context |
|---|---|---|
| Credit (HY OAS) | 271bps | Richest decile of 25 years. Not confirming stress. |
| Central bank gold buying | +69% y/y | Q2 2026 versus the trailing four-quarter average. The one debasement-leaning signal. |
| Copper versus gold, YTD | 17% / 8% | Industrial metal leading the monetary metal. A real-economy signal. |
| CUSMA | Unresolved | The US declined to extend at the July 1 joint review. A live risk to the Canada side of this view. |
Cross-Asset Snapshot
| Measure | Level | As of | Context |
|---|---|---|---|
| S&P 500 | 7,759 | Aug 10 | Near the highs after a record close of 7,737 on Aug 4 |
| Dow Jones Industrial Average | 53,913 | Aug 10 | Crossed 54,000 for the first time earlier this year |
| US 10Y Treasury | 4.69% | Aug 10 | Around the highest levels since January 2025 |
| DXY | 99.6 | Aug 8 | Consolidating, not broken |
| Fed funds target | 3.50–3.75% | Aug 8 | On hold. Markets pricing meaningful odds of a September hike. |
| Gold | $4,385/oz | Aug 10 | Up roughly 28% year over year, well below the January peak |
| Silver | $64.07/oz | Aug 10 | Roughly 47% below the late-January all-time high |
| Copper | $6.59/lb | Aug 10 | Trading around record levels on a physical deficit |
| Brent crude | $86.26 | Aug 10 | Major forecasters see $65–$85 by 2027 |
| High yield OAS | 271bps | Aug 6 | Richest decile of 25-year history |
Sources: index and commodity levels from Financial Modeling Prep, retrieved August 10, 2026. High yield OAS from ICE BofA US High Yield Index OAS via FRED (BAMLH0A0HYM2), close of August 6, 2026. Policy rate and DXY as of August 8, 2026.
1. Record Index, Diverging Market
The S&P 500 closed at a record 7,737 on August 4. The Dow crossed 54,000 for the first time. The Q2 beat rate came in at 86% against a 78% five-year average, the strongest since 2021. On paper, everything is fine.
Underneath, the market is not pulling in one direction:
- The SOX semiconductor index fell roughly 25% from its June peak during July, a 20.6% decline for the month
- The Nasdaq 100 remains about 2% below its June record even as the S&P 500 and the Dow print new highs
- The equal-weight S&P and the Dow posted their best relative month on record through June and July
- Nvidia sits roughly 20% below its peak while the index it anchors trades at a record
Concentration is why this matters more than an ordinary sector rotation. The top 10 S&P names carried 40.7% of index weight at year-end 2025 (RBC Wealth Management), well past the 27% dot-com peak and nearly double the 18–23% range that held from 1990 to 2015. Estimates through mid-2026 range from 34% to 43% depending on methodology and date; ArcStone Financial Pulse anchors to the RBC figure as the most recently dated, like-for-like top-10 measure. Ten names can carry the tape to new highs while the other 490 quietly do something else entirely. That is what appears to be happening: a narrow exit from risk holding the headline number up, not a broad one.
A deeper layer: early AI money appears to be recycling further out the risk curve. The S&P Kensho Global Quantum Computing Index ran up 69% through May, gave most of that back, then rose more than 20% in the first week of August. That pattern is characteristic of fast, rotating capital rather than settled conviction positioning. Nvidia's April Ising launch was the proximate catalyst. The relevant read for this commentary is directional rather than fundamental: this is not money leaving artificial intelligence, it is money moving from the infrastructure build discussed in Section 4 toward its speculative, pre-revenue edge.
| Rotation versus top: the working distinction. Rotation is capital shifting between leadership groups inside a market that is still rising. A top is capital broadly leaving. Most of the evidence below favours rotation. The capex financing stack in Section 4 is the one place that could change that. |
2. Canada and the US: A Bifurcation, Not a Coupled Trade
Skip the GDP prints. They are noisy and backward-looking. The more informative Canadian story is a policy unlock: Ottawa is opening access to precisely the resources the world is short of, after a decade of self-imposed restriction. The more informative US story is an investment supercycle carrying growth almost single-handedly. Different engines, different risks, and one live wildcard in CUSMA that could affect the Canadian side materially.
Canada: the prior decade's restrictions are coming off
- Prime Minister Carney secured agreement with Alberta and British Columbia for a new 1 million barrel per day pipeline to the Pacific coast, a project the previous government declined to approve. The BC tanker ban is being adjusted to accommodate it.
- Federal framing has shifted explicitly toward energy superpower positioning, with a stated goal of doubling non-US energy exports over the next decade from a base where roughly 95% goes to a single customer
- Canada ranks first globally in potash and second in uranium, and supplies 71% of US potash consumption
- Approximately $18.5 billion in critical minerals projects had been mobilised as of March 2026, and a new C$2 billion Critical Minerals Sovereign Fund is being established for direct equity and supply-agreement investment
The wildcard: CUSMA is not a formality this cycle
- The US declined to extend CUSMA at the July 1, 2026 joint review. The agreement does not expire, it runs to 2036, but that decision triggers ongoing annual reviews and active renegotiation pressure in place of a settled 16-year term.
- As of early August, Canada had not begun substantive text-based negotiations with the US, unlike Mexico, which is already in bilateral rounds
- Sectoral tariff friction in steel, aluminum, autos and lumber remains open and unresolved alongside the review
This is the tail risk that matters most for the Canadian side of this view. The resource build-out is real and underway regardless of Washington, but a materially deteriorating CUSMA outcome, whether renewed or expanded sectoral tariffs or a stalled review that drags into 2027, would affect the export channel for the exact commodities Canada is now moving to unlock. The upside case and the downside case are live simultaneously.
US: growth is real, but investment is carrying it rather than the labour market
The July payrolls miss of 23,000 jobs is a single data point. The more significant figures: business capital expenditure ran at 8.4% annualised in Q2 on top of Q1's 10.6%, and household and business domestic demand grew at 3.3% annualised, the fastest pace in three years. Independent estimates attribute roughly 100 to 140 basis points of 2026 US GDP growth to AI-related capital expenditure alone. This is the concentration story from Section 1 in macroeconomic form: US growth is increasingly a function of hyperscaler investment rather than broad-based hiring or consumption. That is genuine acceleration, and it is narrower than the headline growth number suggests.
| Why the distinction matters. These are two different sets of conditions that happen to correlate with the same rotation thesis, not a single North America call. Canada's resource story is a policy-driven, multi-year unlock with a live geopolitical tail risk attached. The US story is an investment supercycle concentrated in a handful of names, which is the fragility this commentary has been tracing from the outset. The two warrant separate analysis rather than being treated as one exposure. |
Sources: Al Jazeera, CBC News, White & Case (CUSMA and pipeline); Natural Resources Canada, Canadian Mining & Energy, IEA (critical minerals); Fisher Investments, Bridgewater, US Treasury (US investment and GDP); Bureau of Labor Statistics (payrolls); Bank of Canada.
3. What Credit Is Not Pricing
2008 was a credit event wearing an equity mask. Spreads widened for months before the equity market registered it. That mechanism is not present in the current tape.
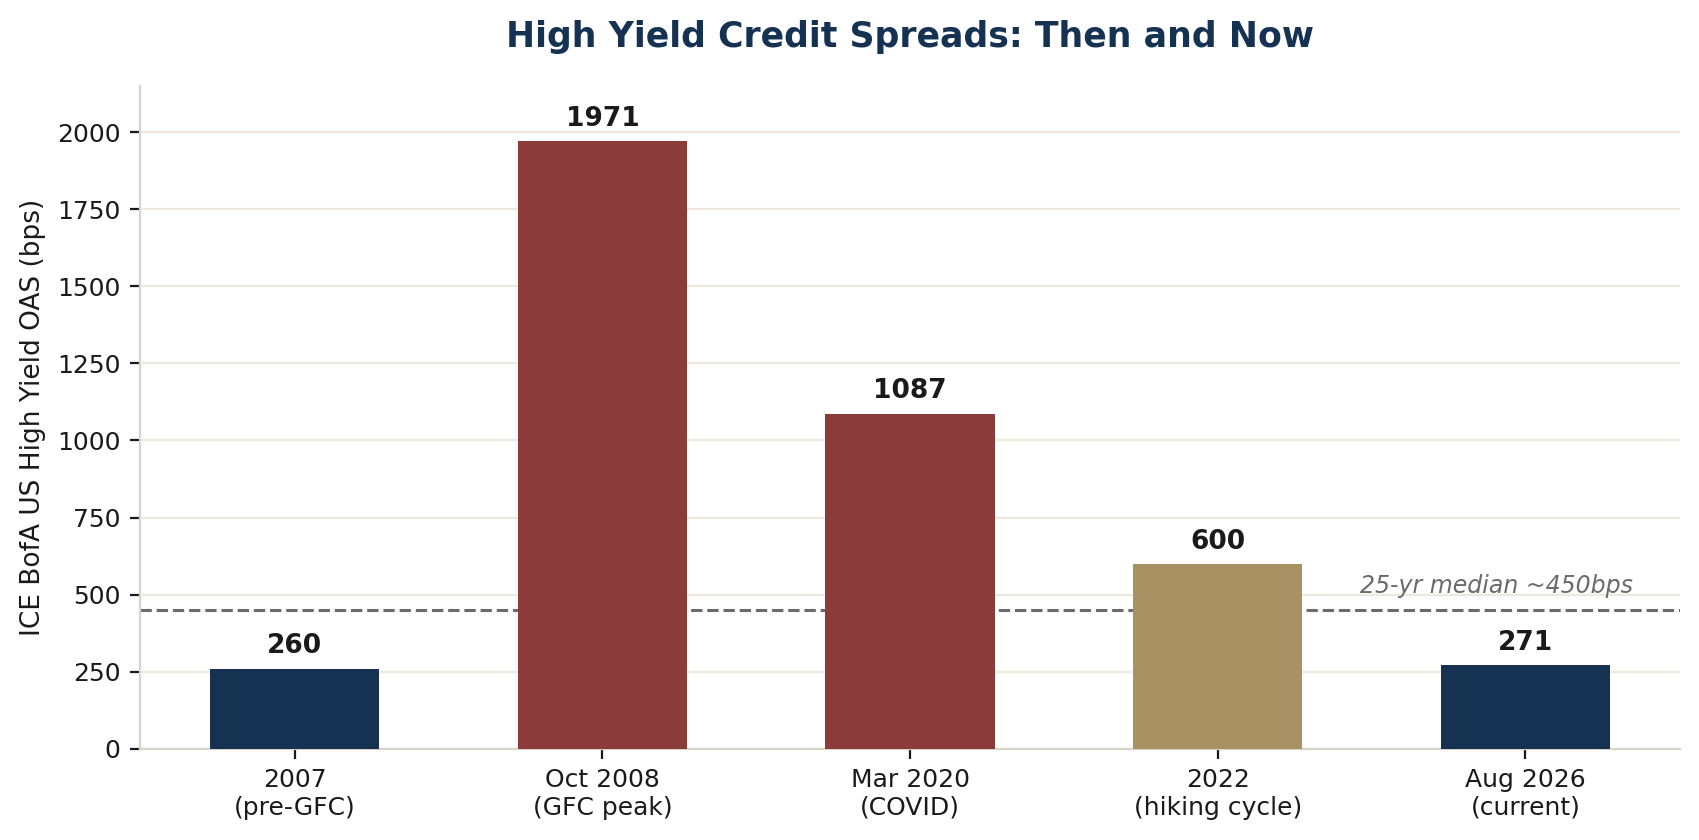
- High yield OAS at 271bps, the richest decile of 25-year history against a median near 450bps
- Investment grade at 81bps, BBB at 100bps, and a high yield to investment grade ratio near 3.5x, in line with the long-run average. Tightness is broad-based rather than a single-tier distortion.
- Fed funds at 3.50–3.75% and holding, but with a hawkish posture. Chair Warsh, in the role since May 2026, has run an inflation-first line and has publicly resisted pressure from the President for cuts, with markets pricing real odds of a September hike against 4.2% CPI. The 2s10s spread sits at +35bps and is re-steepening; the MOVE index at 74.7 is dormant.
Two honest readings, and this update does not pick between them
- One reading: balance sheets are genuinely healthier than in 2008. Spreads are pricing the earnings backdrop rather than complacency.
- The other: spreads this tight are asymmetric. There is limited room left to tighten and considerable room to gap wider when a catalyst appears.
Both are defensible on the current data. What would move the argument:
- A widening BB to CCC differential, indicating late-cycle reaching for yield
- An accelerating high yield issuance pace, with supply doing the softening
- Spreads leaking wider while equities sit at highs, historically the clearest tell and the one rarely identified in real time
None of these has appeared to date.
4. The AI Capex Balance Sheet
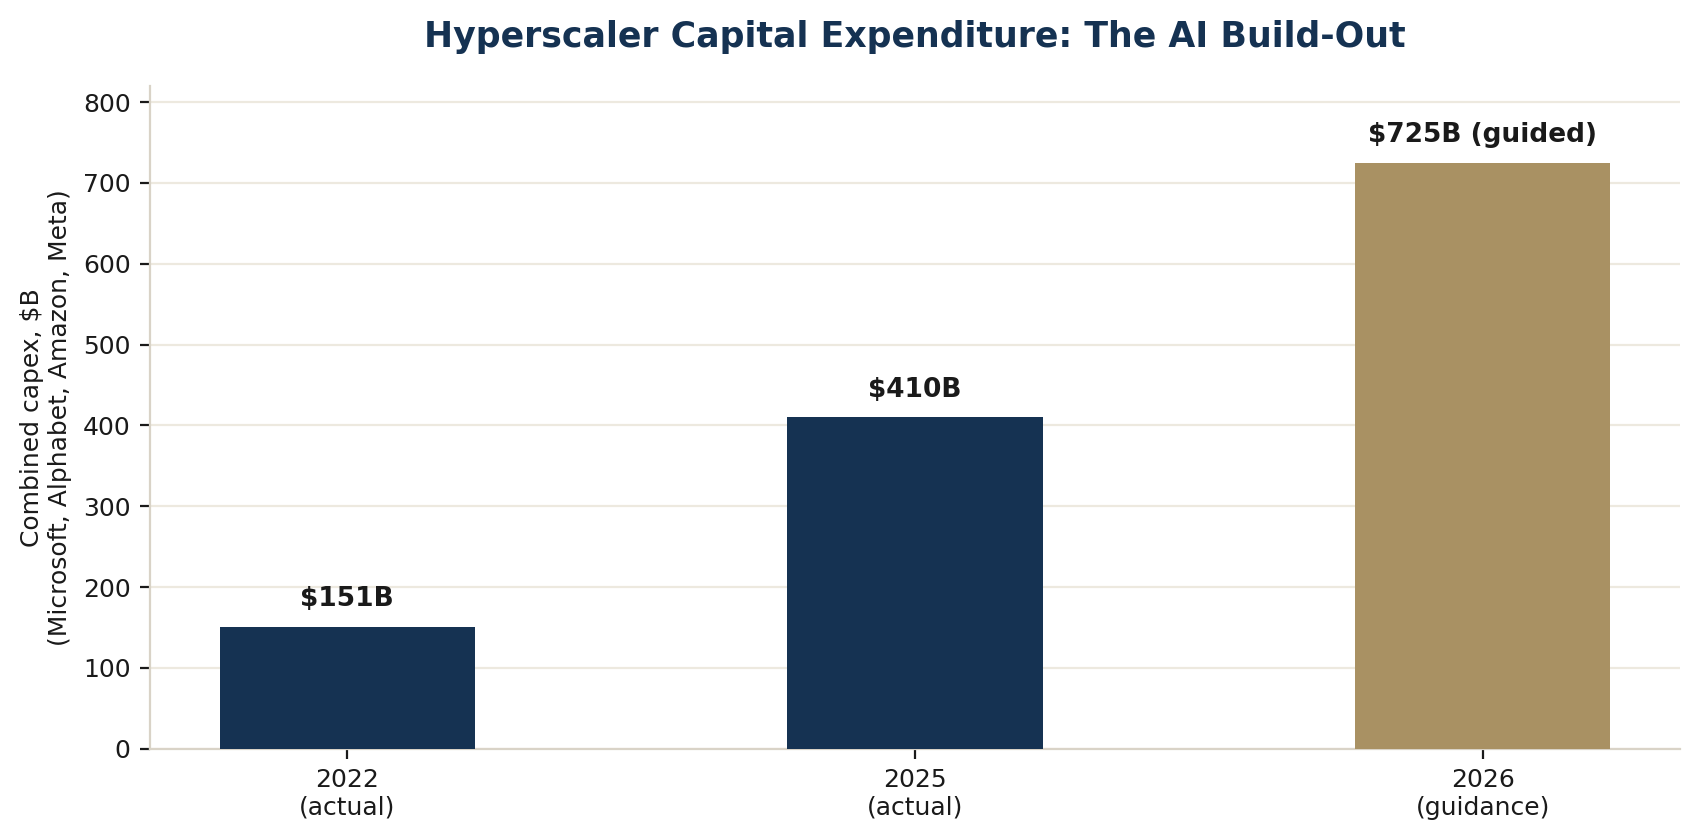
Microsoft, Alphabet, Amazon and Meta are collectively guiding to $725 billion of 2026 capital expenditure, up 77% year over year and nearly five times the 2022 figure. That is not a typo. That is the pace of the build-out.
Financing is shifting from cash flow to debt
- Trailing twelve month capital expenditure through March 2026 of $433.9 billion against roughly $149 billion of depreciation, a structural and widening gap
- Meta: a $30 billion investment grade bond, the largest of 2025, plus roughly $27 billion of off-balance-sheet special purpose vehicle financing
- Alphabet: roughly $25 billion in November 2025 and roughly $31 billion in February 2026. Amazon: $24.9 billion following $15 billion in November 2025.
Where observers disagree
Those who are relaxed about it point out that these are investment grade rated, cash-generative businesses financing infrastructure with a multi-decade life, which is a materially different proposition from the leveraged bank balance sheets of 2008. Those who are not point out that off-balance-sheet vehicles are how late-cycle build-outs have historically financed themselves, right up until they could not. David Cahn of Sequoia Capital has estimated the gap between AI infrastructure spending and AI ecosystem revenue at roughly $600 billion a year, and describes it as widening rather than closing.
This update reports the disagreement rather than settling it. The financing data above is the part worth tracking either way.
| Where the two risks converge. Top 10 S&P weight of 40.7% at year-end 2025 and AI capital expenditure concentration sit in the same handful of names. A hyperscaler credit repricing and an equity concentration event are not two separate risks, they are one risk in two forms. That is the mechanism by which an orderly rotation would stop being orderly. |
5. Gold, Oil and the Broader Commodity Rotation
Gold has already made its move. Oil is telling a different story. Underneath both, the commodity complex is running the same internal rotation this commentary has traced in equities: capital moving between groups rather than leaving the asset class.
Gold: the hedge that is already moving
Spot gold traded near $4,385 per ounce on August 10, up roughly 28% year over year, with the move accelerating after a weak July jobs report. While equity and credit are still arguing the question, gold has already voted.
- Central bank buying has continued alongside institutional flows, discussed in detail in Section 6
- The pattern reads as insurance purchased alongside continued equity exposure rather than capital leaving risk assets
- A crosscurrent worth holding onto: gold remains well below its January 2026 peak. Bank forecasts for end-2026 and 2027 cluster in the $4,800–$5,600 range (Morgan Stanley through Goldman Sachs, JPMorgan and UBS), with Bank of America's $8,000 an outlier rather than a central case. This is not a clean one-way move.
Oil: structurally well supplied, which cuts against the Canadian pipeline story
Brent traded at $86.26 on August 10, down substantially from the $138 spike during the worst of April's Iran conflict. That decline is not solely de-escalation, it is supply. OPEC+ continues adding barrels back as it unwinds voluntary cuts. The EIA sees Brent averaging $74 in Q3 and falling to $65 by 2027. JPMorgan is at $78 by year-end and Goldman Sachs at $85 as a central case.
Stated plainly: Canada is moving to add a million barrels a day of new export capacity into a market that every major forecaster expects to be well supplied through 2027. The pipeline unlock remains a sound long-term proposition, and the near-term backdrop it launches into is a headwind.
The tension is worth flagging rather than resolving away. Every one of those forecasts is a supply-side call, and none prices capital rotation. If the core view in this commentary is correct and capital is genuinely rotating toward hard assets, oil does not get a permanent exemption because it is well supplied today. Gold and copper moved first because the story reached them first, gold as the hedge and copper on its own physical deficit. Oil is the laggard in that rotation rather than outside it. A supply glut can hold the line for an extended period, which is the central case here, but that is a constraint on timing rather than a repeal of the mechanism. Section 6 sets out what would need to change.
Copper is the sharpest confirmation of rotation, not of the tail case
The commodity complex is rotating internally as well. Bloomberg Commodity Index precious metals fell 7.6% while industrial metals rose 6.6% over the same window, with copper and tin setting records on physical demand from electrification, grid build-out and the same data centre power demand behind Section 4's capital expenditure. Copper is up roughly 17% year to date against gold's roughly 8%, on a refined supply deficit of 150,000 to 330,000 tonnes (ICSG, JPMorgan Global Research) rather than currency flight.
If this were genuinely debasement-driven, monetary metals would lead and industrial metals would lag. They are not. Copper is in front, which is the strongest evidence to date for the rotation reading in Section 1, and it is not evidence for the debasement case in Section 6.
| Commodities are not one exposure. Gold is a concentration hedge that has already worked. Oil faces a genuine supply glut regardless of the Canadian story. Industrial metals are taking the baton from precious metals on physical demand. Each warrants separate analysis. |
Sources: Fortune (Brent spot); EIA Short-Term Energy Outlook, July 2026; JPMorgan Global Research; Goldman Sachs; Bloomberg Commodity Index mid-year review 2026; Financial Modeling Prep (copper and gold levels, August 10, 2026); ICSG and JPMorgan Global Research (copper deficit); published bank forecasts from Morgan Stanley, Goldman Sachs, JPMorgan, UBS and Bank of America (gold targets).
6. Tail Scenario: The Debasement Case
Everything above treats gold and oil as hedges inside a market that is still working. This section sets out the alternative: not a hedge, but a repricing of hard assets against a fiat system losing credibility. This is ArcStone Financial Pulse's house view on an 18-month horizon, and it runs on its own independent axis rather than as a fourth component of the near-term regime probabilities in Section 8. A debasement outcome could unfold underneath rotation, a valuation top or a credit unwind alike, which is why it is scored separately rather than folded into that 100%.
| Metric | Central case (~60%, near-term regime) | Debasement tail (~25–30%, separate 18-month axis) |
|---|---|---|
| Gold | $4,800–$5,600 (Morgan Stanley through Goldman Sachs, JPMorgan, UBS) | $10,000+ |
| Oil (Brent) | $65–$78 (EIA, JPMorgan, Goldman Sachs) | $150+ |
| Primary driver | Concentration hedging, tactical | Reserve-currency confidence break |
| DXY | Consolidates near current levels | Structural breakdown, accelerating |
The probabilities in this table are ArcStone Financial Pulse's own estimates of conviction, not market-implied probabilities. Gold and oil forecast ranges are sourced as in Section 5.
The fiscal arithmetic is already running, and this leg does not depend on the Fed
- The CBO's February 2026 baseline puts the FY2026 deficit at $1.9 trillion, or 5.8% of GDP, rising to $3.1 trillion, or 6.7% of GDP, by FY2036
- Debt held by the public at 101% of GDP in FY2026, reaching a record 108% by FY2030, surpassing the 1946 postwar high, and 120% by FY2036. Nominal debt held by the public rises from $21.0 trillion to $56.2 trillion over that span.
- All three major rating agencies have now withdrawn the United States' last AAA rating
Source: Congressional Budget Office, The Budget and Economic Outlook: 2026 to 2036, February 2026, direct.
Central banks: more textured than steady buying, and more interesting
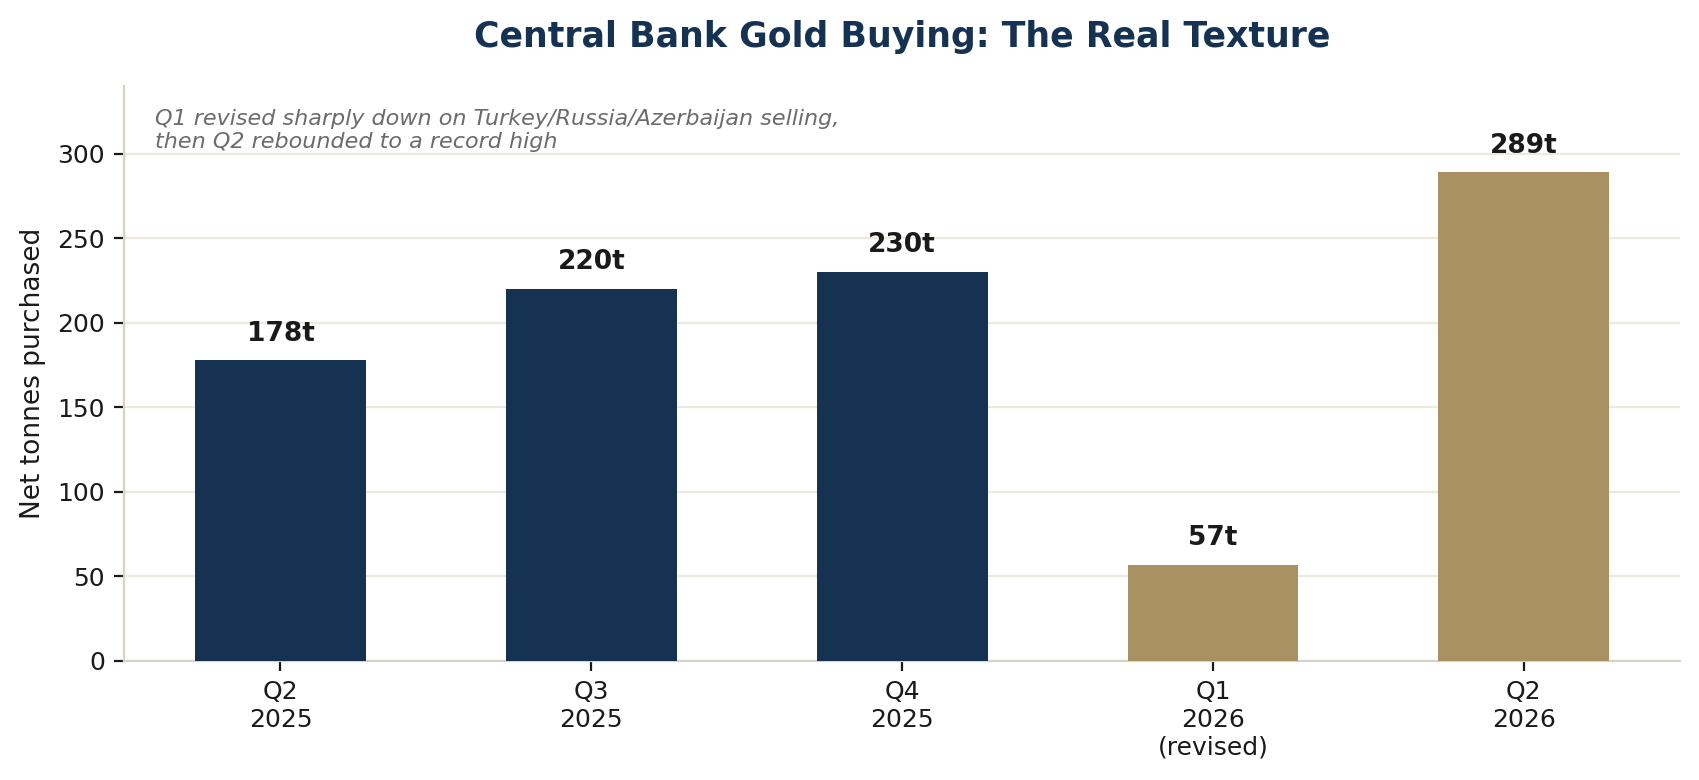
- H1 2026 central bank net purchases were the lowest since 2022 at 345 tonnes. The World Gold Council's Q1 estimate was revised sharply down to 57 tonnes following heavy selling from Turkey, Russia and Azerbaijan.
- Q2 alone then reached a record 289 tonnes, up 62% to 74% year over year, while prices posted their steepest quarterly decline in a decade. Poland added 51 tonnes toward its 700 tonne target and China added 33 tonnes, its largest addition since late 2023, as the Q1 sellers slowed.
- A World Gold Council survey of 76 reserve managers, the highest participation in the survey's nine-year history, found 89% expect global gold holdings to keep rising and 74% expect the dollar's reserve share to fall over the next five years
- BRICS+ gold reserves stand at 17.4% of the global total, up from 11.2% in 2019
The dollar and the Fed: a real complication for the near-term case
Stated straightforwardly rather than selectively: the Fed leg of the debasement mechanism is weaker now than it was six months ago. Kevin Warsh took over as Fed chair in May 2026 and has run hawkish rather than dovish, holding at 3.50–3.75% through two meetings and publicly resisting the President's push for cuts, with 4.2% CPI keeping real rates a headwind for non-yielding gold rather than a tailwind. Markets are pricing meaningful odds of a September hike rather than a cut. The DXY at 99.6 has consolidated in the high-90s to low-100s, with most of its decline having occurred before Warsh took the seat. That is a genuine check on the 18-month timeline, even with the fiscal and central bank legs above intact.
Japan: the canary, not a footnote
- The yen fell to 40-year lows, down 13% since April, as JGB yields reached decade highs, compounded by new Prime Minister Takaichi's snap election call and sales-tax-cut pledge
- On August 1, the US intervened to support the yen for the first time in 28 years, with Treasury and Japan jointly buying $5–10 billion in the first coordinated US-Japan FX action since 2011
- Japan holds $1.1 trillion in US Treasuries, the largest single foreign holding. Forced Japanese selling to defend the yen would push US yields higher directly. Secretary Bessent has separately been reported as pressing the Fed to expand the FIMA repo facility.
This warrants careful reading rather than treatment as free confirmation. The acute stress is in Japan's currency and bond market, not the dollar's, and the DXY firmed on the intervention. The accurate characterisation is reserve-currency-adjacent sovereign debt under systemic strain, not the dollar being debased. That is a broader argument for hard-asset insurance than a narrow US-only framing, even as it complicates the simple DXY-breakdown mechanism.
Sources: Reuters, Bloomberg, CNBC, Fortune and other financial news services (Bessent and Japan intervention, August 2026).
| What would indicate this scenario is playing out. Warsh's hawkish stance breaking under continued political pressure. Japan forced into outright Treasury sales despite the intervention, or a genuine expansion of the FIMA facility. Real 10-year yields turning negative despite the current hold. Central bank buying re-accelerating past the 1,000 tonne annual pace. The DXY breaking cleanly below its current consolidation. Gold holding above its inflation-adjusted 1980 peak, already achieved, without a meaningful pullback on the next wobble. |
On oil following gold. Gold does not need a shortage to reach $10,000, it needs a confidence break. Oil is harder. Section 5's supply glut is real, and debasement alone would have to override spare capacity sitting unsold. It would need either the same currency logic overriding the physical surplus, or an actual supply reversal, whether a genuine Hormuz closure or OPEC+ returning to restriction. Neither is the current central case.
Sources: JPMorgan Fed meeting coverage, Al Jazeera, CNN Business (Warsh, FOMC); TradingEconomics, Vantage Markets (DXY).
7. Iran: The Exogenous Tail
- Iran and Oman have reached broad agreement on Hormuz shipping-route coordinates, and President Trump has said reopening will occur soon
- Countervailing: an Iranian military adviser has stated Tehran will not tolerate the US blockade indefinitely, and the PGSA permitting regime remains unresolved
- Brent spiked to $100.69 on July 23 before retreating. This is not the central case, but it is a real tail.
The mechanism worth watching: an actual Hormuz closure would be inflationary through energy, which would give Chair Warsh's already-hawkish Fed more reason to hike rather than hold. Tighter policy would then be a headwind for both the equity rally and non-yielding gold simultaneously. That is one of the few scenarios in which an orderly rotation would stop being orderly.
8. Is This 2008? A Framework
On the current evidence, probably not. But the test is the mechanism rather than the resemblance; record indices and concentrated leadership look similar from a distance regardless of what is driving them.
| Signal | 2008 top | Today (August 2026) |
|---|---|---|
| Credit spreads | Widened for months pre-top; HY OAS peaked above 1,900bps | 271bps, richest decile, no widening trend |
| Locus of leverage | Banks and mortgages, opaque to equity investors | Cash-generative hyperscalers, still investment grade, debt and SPV financed |
| Index breadth | Narrowing into fewer names | Rotating between groups; equal-weight and Dow outperforming |
| Earnings backdrop | Deteriorating into crisis | Strongest beat rate since 2021 (86% versus 78% average) |
| Concentration | Top 10 at approximately 27% (2000 peak) | Top 10 at 40.7% (year-end 2025), unprecedented but earnings-backed |
Sources: ICE BofA via FRED; company filings; Goldman Sachs; FactSet; RBC Wealth Management; Apollo Academy.
Every row favours rotation. One caveat is worth sitting with: credit spreads did not warn ahead of the 2000 top either, because that was a valuation event rather than a credit event. If this cycle proves more dot-com than 2008, credit will not be the indicator that signals it. The capital expenditure and concentration overlap in Section 4 would be.
Two separate assessments, not one partition. Near-term equity and credit regime over 12 months: approximately 60% that rotation continues, approximately 25% that this resolves as a dot-com-style valuation top, and approximately 15% a 2008-style credit-driven unwind. These are mutually exclusive states and sum to 100%.
The debasement tail over 18 months sits at approximately 25% to 30% on its own independent axis. It is not a fourth component of the distribution above. It is a separate question, and a debasement outcome could unfold underneath any of the three near-term regimes, which is why it does not need to fit inside that 100%. All of these figures are ArcStone Financial Pulse's own estimates of conviction rather than market-implied probabilities.
Risks to This View
- Credit is a lagging indicator here, not a leading one. Spreads did not warn ahead of 2000. If this is a valuation-led unwind rather than a credit-led one, the framework in Section 3 offers less protection than it appears to. Concentration estimates also move quickly: this commentary anchors to 40.7% at year-end 2025, while other dated snapshots run from 34% to 43%. The direction of travel matters more than the precise level.
- The SPV financing structure is opaque by design. Off-balance-sheet vehicles are definitionally harder to size and stress-test from outside. The read on hyperscaler leverage in Section 4 is necessarily incomplete.
- Hormuz is a binary that cannot be handicapped. De-escalation is the current trajectory, but this has whipsawed twice already this year. A closure event would break the rate assumption underneath both halves of this view at once.
- CUSMA is the real Canada-side risk, not a formality. The US declined to extend on July 1, and Canada has not begun substantive text negotiations. A stalled review or expanded sectoral tariffs would affect the export channel for the exact commodities the resource story in Section 2 depends on.
- Oil's supply glut could persist longer than the pipeline timeline assumes. The EIA, JPMorgan and Goldman Sachs all see continued oversupply into 2027. Canada's new export capacity does not come online until September 2027 at the earliest, into a market forecasters expect to still be long barrels.
ArcStone View
Capital appears to be rotating rather than fleeing. ArcStone Financial Pulse holds that at moderate conviction rather than high, because credit spreads are better at identifying credit-driven tops than valuation-driven ones, and this cycle has a foot in both camps.
What that looks like across the areas this update has covered, stated as observations about market conditions rather than as positions:
- Equity concentration is the distinguishing feature of this tape, not the level of the index. The interesting question is how much of the move rests on ten names, not whether the number is high.
- AI infrastructure is a financing story before it is a demand story. Credit is not flagging stress, and leverage is building. Section 4 is where those two facts have to be held together.
- Gold flows continue to read as hedging alongside retained equity exposure rather than as risk-off. That is a different signal from money leaving.
- Investment grade credit at these levels is being carried by carry, not by further spread compression. There is not much room left in the second of those.
- Oil faces a structural supply picture that the EIA, JPMorgan and Goldman Sachs all read as well supplied into 2027, which currently sits heavier on price than the Hormuz tail risk does.
- Canada's resource unlock in energy, potash and uranium is real, multi-year and underway regardless of Washington, and CUSMA is the live risk attached to it.
What would change the read
- AI-infrastructure-specific credit spreads widening meaningfully
- Hyperscaler investment grade issuance pace slowing
- The AI revenue and capital expenditure gap beginning to narrow rather than widen
None of these is occurring yet. The day one of them does is the day the rotation reading needs a second look. Separately, the debasement tail in Section 6 runs on its own 18-month clock, independent of whether the central case above resolves as rotation or as something worse, and it should be tracked against its own indicators rather than these.
This commentary extends the structural case set out in The Hard Asset Turn (ArcStone Financial Pulse, August 2026): capital rotating toward hard assets and away from purely financialised exposure. That piece made the multi-decade case. This one is the near-term read on whether equities and credit are confirming it yet.
Methodology
Index and commodity levels are as of August 10, 2026 unless otherwise stated in the Cross-Asset Snapshot. The high yield spread comparison in Section 3 uses illustrative cycle-peak points rather than a continuous series; see FRED series BAMLH0A0HYM2 for the full history. Hyperscaler capital expenditure combines actuals for 2022 and 2025 with guidance for 2026, and is not fiscal-year-adjusted across companies. Scenario probabilities in Sections 6 and 8 are ArcStone Financial Pulse's own estimates of conviction, not market-implied probabilities.
ArcStone Kingswood Growth Summit 2026
Join us September 16 at the Sheraton Centre Toronto for the 3rd Annual ArcStone Kingswood Growth Summit. A full day of fundraising, going-public, and cross-border listing conversations bringing together issuers, investors, and capital markets leaders. This is by invite-only gathering.
Register today to secure your personalized invitation
Disclaimer and Forward-Looking Statements
This commentary has been prepared and published by ArcStone Financial Pulse Inc. ("ArcStone Financial Pulse") for informational purposes only. It addresses economic, market, and asset-allocation conditions generally, and does not analyze the equity securities of any individual company. Nothing here constitutes an offer, solicitation, or recommendation to buy or sell any security, commodity, or instrument, nor investment, legal, tax, or accounting advice, and it is not tailored to the investment objectives, financial situation, or needs of any individual.
The views expressed have not been influenced by any pending or existing investment banking, advisory, or distribution relationship, and no part of any preparer's compensation is tied to the views expressed.
ArcStone Financial Pulse Inc. is affiliated with entities that provide advisory, capital markets, investor relations, and content services to issuers, including issuers in the energy and oil and gas, precious metals, copper and critical minerals, potash and fertilizer, uranium and nuclear, quantum computing, and data centre and artificial intelligence infrastructure sectors discussed in this commentary. Those entities receive fees for those services, and in certain cases hold engagements to raise capital for issuers in those sectors. This represents a conflict of interest, as ArcStone may be perceived to have an incentive to present these sectors in a favorable light. This update does not recommend, and is not intended to promote, any issuer to which ArcStone or its affiliates provide services, and no such issuer is named, analyzed, valued, or referred to herein. Where any company is named in this update, it is solely to report that company's own publicly disclosed figures or publicly observable market data; no view is expressed on its securities.
This commentary contains forward-looking statements and forecasts, including third-party forecasts from the U.S. Energy Information Administration, JPMorgan Global Research, Goldman Sachs, Morgan Stanley, UBS, Bank of America, the Congressional Budget Office, and the World Gold Council as cited, and including the scenario frameworks in Sections 6 and 8, which reflect ArcStone Financial Pulse's house view and not a market-implied distribution. These involve significant risk and uncertainty, and actual results may differ materially. Past performance is not indicative of future results. Commodity and precious metals prices are volatile and subject to rapid change from factors outside ArcStone Financial Pulse's control.
The information contained herein is provided by ArcStone Financial Pulse Inc. ("ArcStone Financial Pulse"), a subsidiary of ArcStone Securities and Investments Corp. ("ArcStone"), for informational purposes only. It is not, and under no circumstances should it be construed as, an offer to sell or a solicitation of an offer to buy any securities or other financial instruments in any jurisdiction. This content is not a research report within the meaning of FINRA Rules 2241 or 2242 and does not constitute a research report under any applicable securities laws.
Certain statements contained herein may constitute "forward-looking statements" within the meaning of applicable Canadian and U.S. securities laws. Forward-looking statements are based on current expectations, estimates, and assumptions that involve known and unknown risks and uncertainties which may cause actual results or developments to differ materially from those expressed or implied. These statements often include words such as "anticipate," "believe," "expect," "intend," "may," "plan," "project," "should," "target," or similar expressions. Readers are cautioned not to place undue reliance on such statements, which speak only as of the date made. Except as required by law, ArcStone undertakes no obligation to update or revise any forward-looking information.
This content is not intended as investment advice or a recommendation to buy or sell any security and does not take into account the investment objectives, financial situation, or needs of any individual. Investors should consult their own professional advisors before making any investment decisions.
ArcStone Securities and Investments Corp. is not a registered broker-dealer and does not provide investment advice or recommendations. All registrable activities in the United States are conducted through ArcStone Securities, LLC (CRD# 306029) and/or Kingswood Capital Partners, LLC (CRD# 288898), both FINRA-registered broker-dealers, members SIPC. ArcStone Canada Inc. is not registered as a dealer in any Canadian jurisdiction; registrable dealing activities in Canada are conducted through appropriately registered affiliates.
ArcStone Kingswood is a DBA Office of Supervisory Jurisdiction (OSJ) of Kingswood Capital Partners, LLC (Member FINRA/SIPC) under which registered representatives of ArcStone Securities, LLC (Member FINRA/SIPC) and registered representatives of Kingswood Capital Partners, LLC conduct joint capital markets and investment banking activities. ArcStone Securities, LLC and Kingswood Capital Partners, LLC are parties to a written agreement governing the sharing of fees on transactions in which registered representatives of both firms participate. All securities transactions and investment banking services described in this article are conducted exclusively through ArcStone Securities, LLC and/or Kingswood Capital Partners, LLC; "ArcStone Kingswood" itself is not a registered broker-dealer or separate legal entity.
ArcStone Financial Pulse Inc. is owned by the same parent entity (ArcStone Securities and Investments Corp.) that owns ArcStone Securities, LLC. This common ownership, together with the joint operating relationship between ArcStone Securities, LLC and Kingswood Capital Partners, LLC under the ArcStone Kingswood DBA OSJ banner, represents a structural conflict of interest. This article is general market commentary and does not feature a client issuer. ArcStone and its subsidiaries and affiliates provide advisory, capital markets, and investor communications services to public and private companies and may benefit from market developments or regulatory changes discussed herein. The principals, directors, officers, employees, and related entities of ArcStone and its affiliates may, from time to time, own, buy, or sell securities or derivatives of companies operating in the sectors discussed.
Sources: Federal Reserve Board, FRED (BAMLH0A0HYM2), U.S. Treasury, Congressional Budget Office, Bureau of Labor Statistics, U.S. Energy Information Administration, World Gold Council, ICSG, RBC Wealth Management, Apollo Academy, FactSet, Goldman Sachs, JPMorgan Global Research, Morgan Stanley, UBS, Bank of America, CreditSights, Futurum, Bloomberg, Reuters, CNBC, Fortune, Al Jazeera, CBC News, White & Case, Natural Resources Canada, IEA, Bank of Canada, and Financial Modeling Prep, as cited throughout. Data as of August 6 to August 10, 2026 unless otherwise noted.
© 2026 ArcStone Financial Pulse Inc. All rights reserved. May be redistributed in full and unaltered with attribution.