The Hard Asset Turn: Rates, Rotation, and the Commodity Supercycle

ArcStone Financial Pulse · Market Commentary
What the 1970s bond market teaches about a leveraged, war-disrupted 2026, and why Japan's carry-trade unwind is the second engine behind it.
Market Snapshot
| Measure | Level | Context |
|---|---|---|
| US 10Y Treasury | 4.75% | Highest since Jan 2025 |
| US 30Y Treasury | ~5.28% | Near 2007 highs |
| Germany 10Y Bund | 3.20% | Highest since May 2011 |
| US debt / GDP | ~124% | vs. 31–36% in 1970s |
| Gold (spot) | ~$4,050–$4,300 | ATH $5,602, Jan 2026 |
| Silver (spot) | ~$57–$59 | +48% year-over-year |
| Brent crude | ~$88/bbl | +20%+ in July alone |
| Gold/silver ratio | ~69x | Compressing from ~70x |
| Nvidia 5Y CDS | 82bps | Record high, July 27 |
| Oracle 5Y CDS | 215bps | Post S&P downgrade to BBB- |
| KOSPI (from June peak) | ~−26% | After a 41% trough, 18% rebound |
| Hyperscaler 2026E AI capex | $750B+ | Increasingly debt-funded |
House View
Constructive on commodities and precious metals. Two engines: a cyclical push out of duration as the bond market's patience runs out, and a structural one, four decades of underinvestment in physical supply meeting AI-driven demand. Defensive on long-duration nominal fixed income over a 12–24 month horizon, on two channels pushing the same direction: an inflation-risk premium (Iran, a divided Fed) and a flow-driven one (Japan's carry-trade unwind, Big Tech's shift to net debt issuance). We are not calling a top in equities: this is a rotation call within portfolios, not a directional equity call.
Key Calls
| Stance | Exposure | Rationale |
|---|---|---|
| Reduce | Long-duration Treasuries / IG credit | Direct exposure to the repricing this note forecasts |
| Add | Gold ETFs (bullion-backed), core position | Primary hedge across both the inflation and flow channels |
| Add | Silver ETFs (bullion-backed), satellite position | Higher-beta; dual monetary/industrial demand |
| Add | Industrial metals equities, structural | Electrification demand, less headline whipsaw |
| Tactical | Energy equities, event-driven | Transmission channel for the Iran conflict |
| Increase | Short/floating-rate fixed income, cash | Landing spot for capital coming out of duration |
Why Now
- Two multi-decade continuation patterns, 1965–81 in the US and 2015–2026 globally, are both approaching decade-scale resolution points (Section 1).
- Leverage today is roughly four times the 1970s level; half of the 1981 peak yield could do equivalent or greater damage now (Section 3).
- Japan is repatriating capital and Big Tech has flipped from duration buyer to duration issuer, removing captive demand independent of the inflation story (Section 4).
- Nvidia's credit default swaps hit a record high and Oracle was downgraded to BBB- in the same week, credit markets pricing the AI-capex debt buildout, and the Korea equity selloff, in real time (Section 4).
- Germany's Bund yield just hit a 15-year high and the ECB is pricing two more hikes, confirming this is a global repricing, not a single-country story (Section 1).
Full analysis, risks to the thesis, and disclosures follow. Not investment, legal, or tax advice; ArcStone Financial Pulse Inc. is not a registered broker-dealer or investment adviser. See disclosures below.
Investment Thesis
House view: constructive on precious metals and broad commodity exposure, defensive on long-duration nominal fixed income, over a 12–24 month horizon. The variant view isn't that inflation is back, that's consensus, it's that the bond market's willingness to extend policymakers the benefit of the doubt is a finite resource closer to running out than current pricing admits.
The 10-year Treasury yield closed July at 4.75%, its highest since January 2025, with the 30-year near 2007 levels, fed by two reinforcing channels: an inflation-risk premium (Iran, a divided Fed, a deficit doing much of the inflating, it rhymes with 1973–81) and a flow channel (Japanese institutions and Big Tech balance sheets, the largest captive buyers of long-dated debt, heading for the exits). Neither explains the move alone; together they do.
The whole thesis in one line: a market that took the 10-year to nearly 16% in 1981 doesn't need to repeat that number to do equivalent damage now, because today's debt load, above 120% of GDP versus 30–36% in the 1970s, is roughly four times more levered against the same move. Half of 1981's peak would, in our view, generate comparable stress.
Three linked trades follow: reduce duration, add precious metals (gold core, silver satellite) as the direct hedge against both channels, and hold broad commodity exposure as the conduit carrying the geopolitical leg into realized inflation. None of it requires calling the top in equities, this is a rotation call within portfolios, not an equity bear call.
1. The 1970s Precedent: How Long the Bond Market Gives the Benefit of the Doubt
Treasury bear markets don't begin the day inflation surprises to the upside, they begin years earlier, as long continuation patterns in which the bond market keeps extending policymakers credit they haven't earned. The 1965–81 cycle is the clearest instance: Vietnam-era deficit spending on top of the Great Society budget pushed inflation higher through the late 1960s, and the 10-year drifted from 4.3% in 1965 to 7.6% by 1970, a slow bleed, not a shock.
The Arab oil embargo of October 1973 was the moment the pattern should have broken; it didn't. Yields round-tripped for most of the mid-1970s in the 7–8% range as the market gave the Burns-era Fed room to believe the inflation was transitory, forbearance that lasted six years and ended only when Volcker took Fed funds above 19% in 1981 and the 10-year followed to nearly 16%.
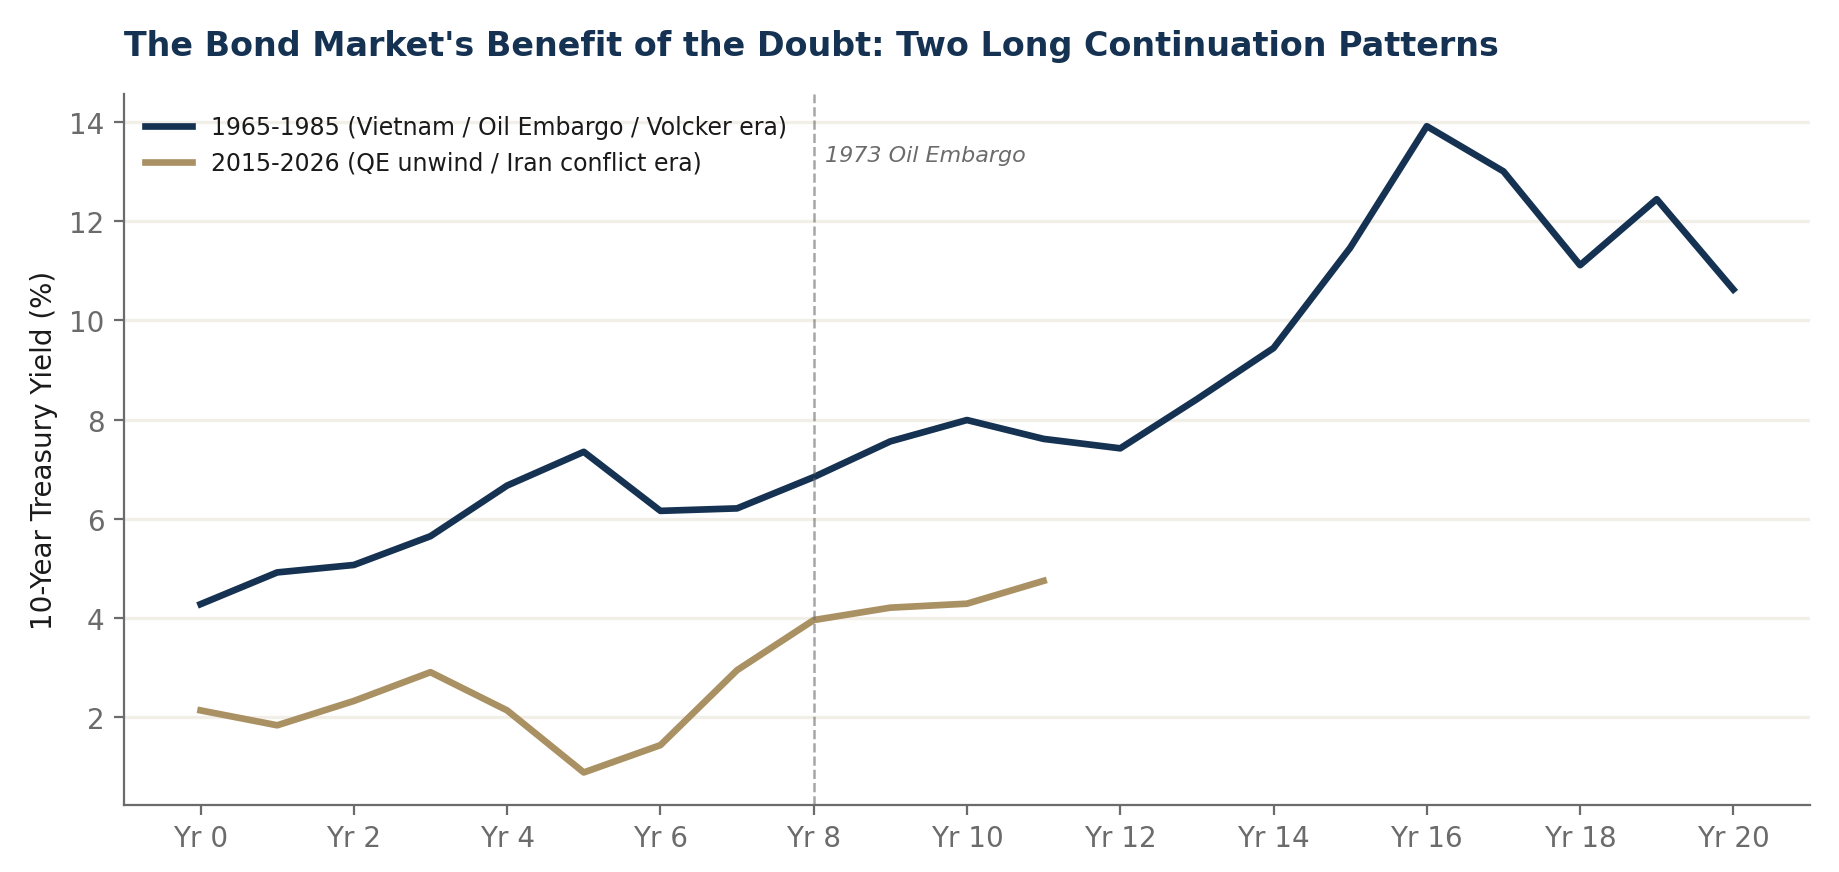
The structural read for today: continuation patterns this long aren't evidence the policy error is being resolved, they're evidence the market's patience has a very long half-life, until it doesn't. The 2015–2026 series above traces the same shape, call it year eleven of the modern cycle's equivalent; the 1965–81 original took sixteen years to reach its terminal yield.
2. The 2026 Parallel: Iran, the Fed, and a War That Will Not Resolve Cleanly
The Iran conflict has functioned as 2026's oil embargo, with a nastier, more volatile transmission mechanism: Brent touched triple digits in March, round-tripped to $65–70 on a June ceasefire, then surged 20%+ in July alone as U.S. strikes and Houthi escalation reopened the supply risk. The volatility itself is the signal, a rolling risk premium embedded in energy and headline inflation for as long as the conflict stays unresolved.
The Fed's response has been genuine institutional disagreement: the July FOMC produced dissents from Kashkari and Logan favoring an immediate hike, while Chair Warsh held rates steady and offered guidance firm enough to be quoted, vague enough to mean nothing. Markets price roughly two-thirds odds of a 25bp September hike, but the split matters more than the outcome, a Fed this divided is one the bond market keeps testing.
This is the 1973–75 pattern in miniature, Burns-era policy oscillated rather than resolved, and the term premium widened to compensate. Expect the same through 2026–27: not a straight line higher, but a rising baseline with sharper air-pockets around every FOMC and escalation headline.
3. The Leverage Asymmetry: Why Half the 1970s Peak Is the Realistic Ceiling
The single most important difference between 1981 and today is the balance sheet the shock is landing on: gross federal debt-to-GDP bottomed in the low 30s through the 1970s and didn't cross 40% until the mid-1980s, versus above 120% today, roughly four times the leverage, with CBO projecting further increases absent a fiscal policy change neither party has proposed.
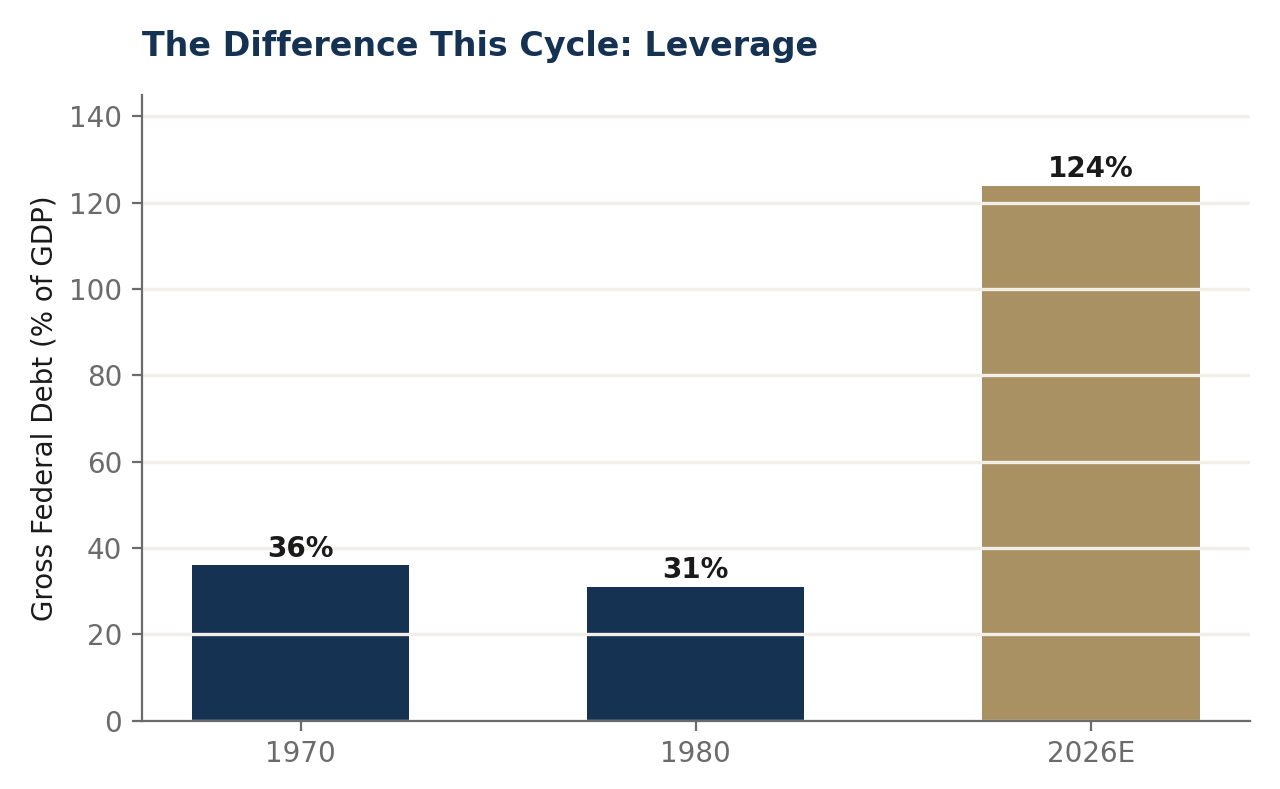
Every 100bp move in the 10-year now flows through a federal interest burden nearly four times larger relative to the economy than in 1981, and the private sector is more levered too, mortgage, corporate, and consumer debt are all a larger multiple of GDP, more of it in duration-sensitive, mark-to-market form rather than buy-and-hold bank portfolios. One nuance cuts both ways: Treasury's roughly six-year weighted-average maturity slows the pass-through to actual debt service, but it also means the bulk of today's low-coupon debt hasn't rolled yet, so the fiscal pain in this scenario is still mostly ahead of us, not behind.
Working estimate: a 10-year yield of 7%, roughly half the 1981 peak, would today generate stress comparable to the mid-teens in 1981, self-reinforcing above that level as higher rates raise debt service, which raises issuance, which pressures yields further, a loop that forces either fiscal consolidation or yield-suppressing intervention. We don't think 7% needs to be reached for markets to react as though it will be, the repricing of that probability is itself the trade.
The obvious release valve, and the one a skeptic will raise first: Treasury can lean harder into bill issuance instead of coupons, the 2023 playbook, to relieve long-end pressure without the Fed doing anything. We think this buys time rather than resolves the thesis; it shifts rollover risk onto a shorter, more frequently repriced base rather than removing it, and doesn't change the underlying leverage math above.
Scenario framework, 10-year Treasury yield, 12–24 month horizon (base rates reflect the July 31, 2026 close of 4.75%):
| Scenario | 10Y target | Probability | Path |
|---|---|---|---|
| Bear | 6.25–6.75% | 25% | Japan/Bund repricing accelerates, a hawkish September FOMC hike, and no durable yen stabilization; term premium re-rates without a full 7% test. |
| Base | 5.25–5.75% | 45% | Continued grind higher on the two-channel thesis (Sections 1–4), punctuated by air-pockets around FOMC meetings and Iran headlines, no forced policy intervention. |
| Bull | 4.25–4.75% | 20% | Faster-than-expected Iran resolution, a soft Fed pivot to cuts, and a durable yen stabilization remove both channels' near-term catalysts. |
| Tail | 7.00%+ | 10% | The self-reinforcing debt-service loop in the working estimate above activates; would likely trigger fiscal or monetary intervention before settling. |
A house view, not a market-implied probability distribution; revisited each quarter or on a material change to Fed policy, Iran, Japan/BOJ policy, US fiscal issuance, or AI-linked credit conditions per Section 4.
One asymmetry cuts the other way: higher leverage also raises the odds that fiscal dominance forces yield-curve-control-style intervention well before 7% is tested. We view this as a real tail risk, not a reason to abandon the thesis, it would likely precede, not replace, a disorderly repricing episode, and it's itself bullish for gold given the currency debasement such intervention implies.
4. Japan, the Carry Trade, and the AI-Credit Stress Test
A second channel, less discussed than inflation, is doing real work at the margin: the largest captive buyers of long-dated developed-market debt are heading for the exits, Japan foremost. The 10-year JGB hit a 29-year high in July as the BOJ, under pressure from Washington, keeps raising rates to defend a yen near its weakest since 1986. Japanese investors sold $29.6bn of Treasuries in Q1 2026 alone, and life insurers become forced JGB sellers if the 30-year breaches 4.5%, now within range. Japan has exported savings and suppressed global yields through this carry trade since the 1980s; unwinding it reverses four decades of that mechanism, independent of next month's inflation print.
Nvidia, Oracle, and Korea
The same dynamic shows up in credit: hyperscalers that spent the 2010s absorbing duration have flipped to net issuers, funding AI infrastructure with debt. On July 27, Nvidia's five-year CDS widened to a record 82bps intraday on reports of AI infrastructure commitments exceeding $750bn, including a $500bn-plus SK Group partnership. Worth being precise: a record move, not a record level, still cheap for investment-grade credit, a repricing of tail risk, not distress. Nvidia's balance sheet isn't the issue (it generated $48.6bn in free cash flow last quarter); credit markets are pricing the risk of Nvidia underwriting its own customers, a lending arrangement that looks fine right up until the customer is also the collateral. Oracle's downgrade to BBB- and 215bps CDS is the genuinely more serious signal.
Days later, Korea's KOSPI, half of which is Samsung and SK Hynix, fell 41% from its June peak before a 17.9% single-day rebound, panic to amnesia in about a month. SK Group is the Nvidia counterparty; SK Hynix is the memory supplier at the center of the buildout. Same doubt, two markets: does AI capex generate returns commensurate with the debt funding it.
Why this matters, and what it isn't: if this flow channel is real, term premium can keep rising even with inflation cooperating, a reason to prefer gold over TIPS here. A genuine AI-credit event would likely be Treasury-supportive near-term even as it validates the medium-term argument, don't expect that to be immediate. This isn't a call on Nvidia, Oracle, or tech; it's evidence for the mechanism above.
5. Capital Rotation and the Case for a Structural Commodity Bull Market
Every regime in which the bond market withdraws the benefit of the doubt has coincided with capital rotating out of duration-sensitive assets into hard, cash-flow-independent stores of value. Historical pattern, not an equity forecast, nothing here calls a top in equities.
The Dow/Gold ratio fell from roughly 28x in the early 1970s to under 2x by the January 1980 gold spike, cited to show the scale a full rotation can reach, not to suggest today's market is positioned for a repeat. Capital can move toward hard assets in relative terms, through flows and multiple compression, without a broad equity drawdown.
Call this early-cycle, not late-cycle: central bank gold buying has run at multi-decade highs since 2022, well ahead of the retail flow that typically arrives once a trend is obvious, the same sequencing that preceded the 1978–80 retail mania.
The structural case: four decades of underinvestment in physical supply, capital redirected into financial and, lately, AI infrastructure instead, is colliding with a real demand shock: AI-driven power and materials needs, electrification, reserve diversification. Call it a long-wave turn back toward a physical-asset-led phase, with precedent in the 1970s and 2000s China supercycles. This is house view, not house fact, pattern-matching rather than the hard data behind Sections 1–4, and it has a self-limiting mechanism: sustained high commodity prices are themselves disinflationary, which eventually softens the demand side.
A forthcoming ArcStone Financial Pulse report applies the same thesis to the physical supply chains beneath quantum computing (helium-3, cryogenics, dilution refrigerators). The cyclical and structural arguments reinforce but don't depend on each other.
6. The Precious Metals and Commodities Cycle
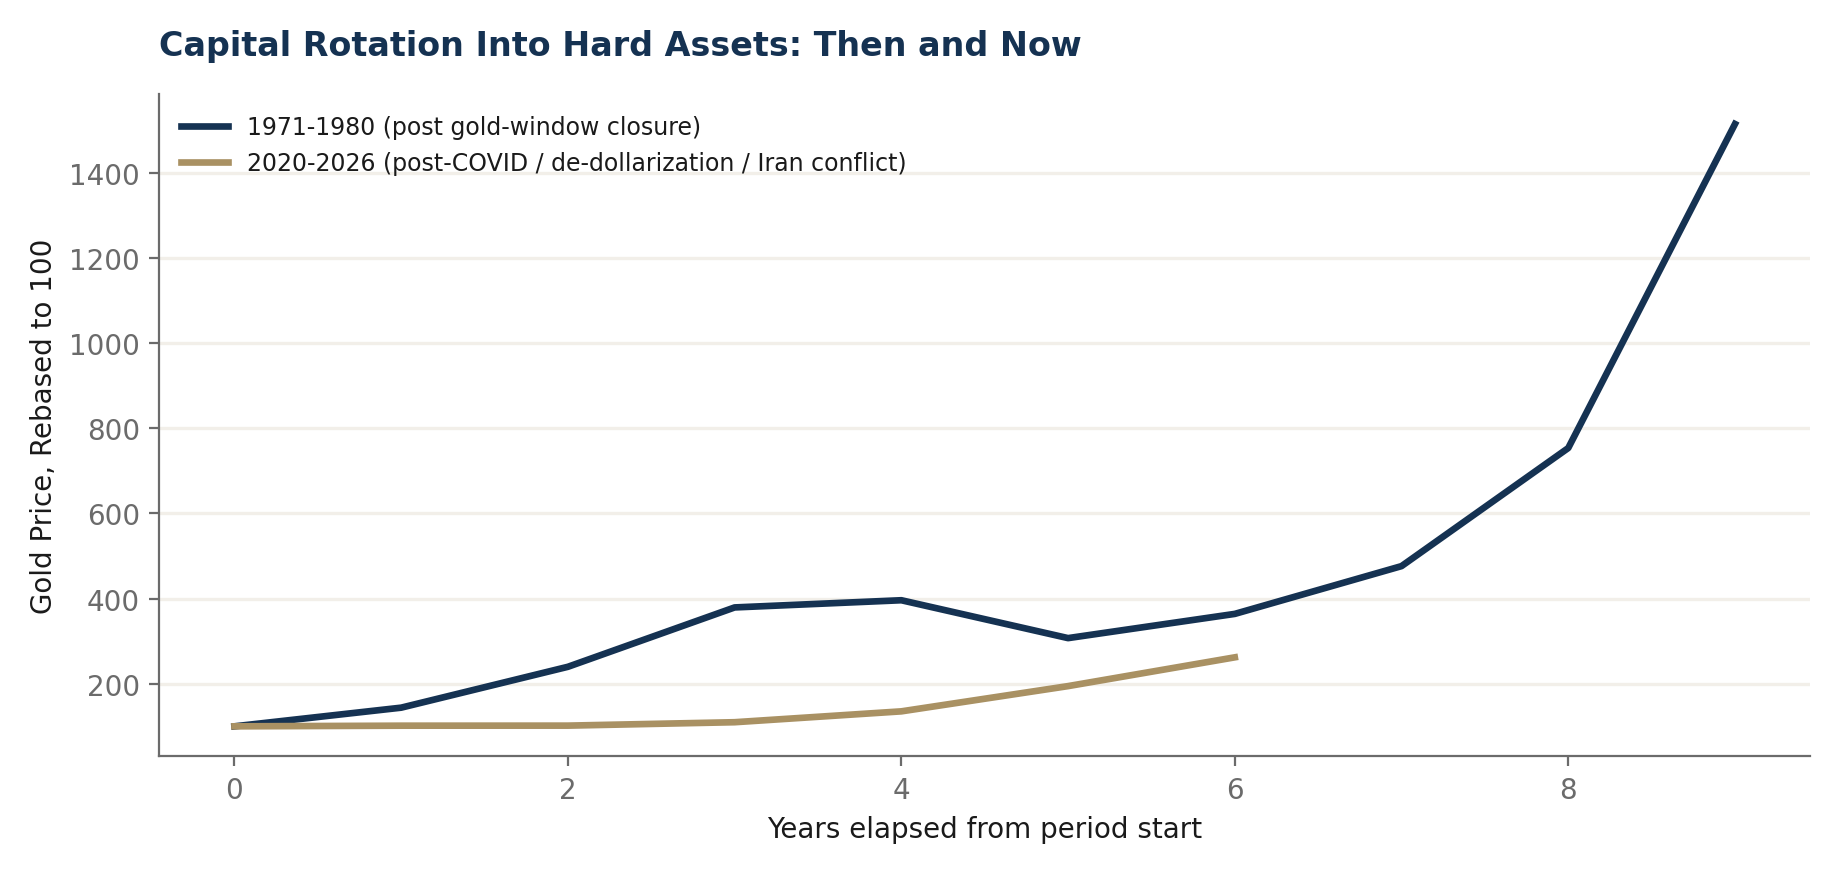
Gold's 1971–80 move, $35 at the Bretton Woods close to a January 1980 spike near $850, remains the reference case for a full monetary-regime repricing. The current cycle traces a similar shape faster: $1,770/oz at the start of 2020 to an all-time high of $5,602/oz on January 28, 2026, now consolidating $4,000–$4,300 as rate-hike risk and dollar strength cap gains. J.P. Morgan targets $6,000/oz by year-end 2026 and $6,300/oz in 2027, contingent on exactly the two variables this note is built around.
Silver has outpaced gold, up roughly 48% year-over-year near $57–59/oz on its dual monetary/industrial demand profile; the gold/silver ratio compressed from 70x to under 69x through the latest Iran de-escalation leg alone. Sell-side targets cluster around $80/oz by year-end 2026, with $100/oz flagged as achievable by 2030, consensus numbers we cite rather than independently triangulate; unlike gold and rates, we don't have a house target for silver specifically.
Energy is the more volatile leg, but it's the transmission mechanism for the whole thesis: Brent's 20%+ July advance is the direct read-through from Iran into headline CPI. Size it tactically, not as a core position, given the whipsaw from March's spike above $100 to June's round-trip near $65–70; copper-linked industrial metals offer a cleaner structural expression.
7. Portfolio Implications
Relative tilts within a diversified portfolio, not standalone recommendations, and not tailored to any individual investor's objectives, risk tolerance, or circumstances.
| Asset class | Stance | Rationale |
|---|---|---|
| Long-duration nominal Treasuries / IG credit | Reduce | Direct exposure to the repricing this note is forecasting; convexity works against holders as yields rise |
| Gold ETFs (bullion-backed) | Add, core position | Primary hedge against both inflation and a disorderly rates repricing; official-sector demand supportive |
| Silver ETFs (bullion-backed) | Add, satellite position | Higher-beta expression; dual monetary/industrial demand; more volatile than gold |
| Industrial metals equities (copper-linked) | Add, structural | Electrification demand plus supply-disruption optionality; less headline whipsaw than energy |
| Energy equities (E&P, midstream) | Tactical, event-driven | Direct transmission channel for the geopolitical shock; size around escalation risk |
| Short/floating-rate fixed income, cash | Increase allocation | Preserves optionality; benefits from higher policy rates without duration risk |
Implementation Notes
Instrument-type observations for translating the stances above into a portfolio, not price targets or security recommendations; sizing and vehicle selection remain the investor's and their advisor's judgment.
- Duration reduction: convexity is greatest in the belly-to-long end (10-year and beyond); short-duration and floating-rate instruments are the natural landing spot for capital coming out, not cash alone.
- Gold, core position: bullion-backed ETFs are the natural vehicle through an equities-focused distribution relationship; mining equities add operational beta on top, direct physical holding remains an option outside a brokerage relationship.
- Silver, satellite position: same preference for bullion-backed ETFs over mining equities, sized smaller than gold given higher volatility; its industrial-demand leg also ties it to the AI-capex question in Section 4.
- Industrial metals, structural: diversified equity exposure (a basket of copper-linked names or a broad metals-equity ETF) over single-name concentration; this is a multi-year call, not a near-term trade.
- Energy, tactical: E&P and midstream equities carry company risk rather than futures' roll/contango risk; either works, but neither warrants more than a tactical allocation given Section 2's whipsaw.
- Reassessment: revisit sizing against the Section 3 scenario triggers and Section 8 risks, not a fixed calendar.
ArcStone Financial Pulse Inc. does not execute, underwrite, or custody securities.
8. Risks to the Thesis
- Disinflation surprise: a faster Iran resolution plus a soft labor print could see the Fed pivot to cuts, removing the near-term catalyst for higher yields, at least temporarily.
- Yen stabilization: a durable fix, following the coordinated intervention of early August 2026, eases Japanese repatriation pressure and removes the strongest leg of Section 4's flow channel, without touching the inflation-premium channel.
- Policy intervention: acute fiscal stress could force yield-curve-control-style intervention well before 7% is tested, capping the yield move even as it validates the debasement thesis for gold.
- Dollar strength: a flight-to-quality dollar rally has repeatedly capped gold and silver through 2026 and remains the primary near-term headwind to the metals leg.
- AI-credit event, near-term direction: per Section 4, a disorderly AI-credit unwind would likely be Treasury-supportive near-term even as it validates the medium-term argument, the likeliest source of a rally in the assets we're recommending reducing.
- Timing risk: continuation patterns like Section 1's can outlast a position's solvency; treat this as a multi-quarter tilt, not a near-term trade.
ArcStone Kingswood Growth Summit 2026
Join us September 16 at the Sheraton Centre Toronto for the 3rd Annual ArcStone Kingswood Growth Summit. A full day of fundraising, going-public, and cross-border listing conversations bringing together issuers, investors, and capital markets leaders. This is by invite-only gathering.
Register today to secure your personalized invitation
Disclosures
ArcStone Financial Pulse Inc. is owned by the same parent entity (ArcStone Securities and Investments Corp.) that owns ArcStone Securities, LLC. This common ownership, together with the joint operating relationship between ArcStone Securities, LLC and Kingswood Capital Partners, LLC under the ArcStone Kingswood DBA OSJ banner, represents a structural conflict of interest. Issuers referred to in ArcStone Financial Pulse content may be current or former clients of ArcStone or any of its subsidiaries and affiliates. Where ArcStone or its subsidiaries and affiliates have received or have been promised consideration for services provided to such an issuer, such consideration may include cash, stock, stock options, warrants, and/or Restricted Stock Units (RSUs) for the provision of corporate advisory, investor relations, digital media, or capital markets consulting services. This relationship represents a potential conflict of interest. The principals, directors, officers, employees, and related entities of ArcStone and its affiliates may, from time to time, own, buy, or sell securities or derivatives of such issuers or their affiliates.
The information contained herein is provided by ArcStone Financial Pulse Inc. (“ArcStone Financial Pulse”), a subsidiary of ArcStone Securities and Investments Corp. (“ArcStone”), for informational purposes only. It is not, and under no circumstances should it be construed as, an offer to sell or a solicitation of an offer to buy any securities or other financial instruments in any jurisdiction. This content is not a research report within the meaning of FINRA Rules 2241 or 2242 and does not constitute a research report under any applicable securities laws.
Certain statements contained herein may constitute “forward-looking statements” within the meaning of applicable Canadian and U.S. securities laws. Forward-looking statements are based on current expectations, estimates, and assumptions that involve known and unknown risks and uncertainties which may cause actual results or developments to differ materially from those expressed or implied. These statements often include words such as “anticipate,” “believe,” “expect,” “intend,” “may,” “plan,” “project,” “should,” “target,” or similar expressions. Readers are cautioned not to place undue reliance on such statements, which speak only as of the date made. Except as required by law, ArcStone undertakes no obligation to update or revise any forward-looking information.
This content is not intended as investment advice or a recommendation to buy or sell any security and does not take into account the investment objectives, financial situation, or needs of any individual. Investors should consult their own professional advisors before making any investment decisions.
ArcStone Securities and Investments Corp. is not a registered broker-dealer and does not provide investment advice or recommendations. All registrable activities in the United States are conducted through ArcStone Securities, LLC (CRD# 306029) and/or Kingswood Capital Partners, LLC (CRD# 288898), both FINRA-registered broker-dealers, members SIPC. ArcStone Canada Inc. is not registered as a dealer in any Canadian jurisdiction; registrable dealing activities in Canada are conducted through appropriately registered affiliates.
ArcStone Kingswood is a DBA Office of Supervisory Jurisdiction (OSJ) of Kingswood Capital Partners, LLC (Member FINRA/SIPC) under which registered representatives of ArcStone Securities, LLC (Member FINRA/SIPC) and registered representatives of Kingswood Capital Partners, LLC conduct joint capital markets and investment banking activities. ArcStone Securities, LLC and Kingswood Capital Partners, LLC are parties to a written agreement governing the sharing of fees on transactions in which registered representatives of both firms participate. All securities transactions and investment banking services conducted by ArcStone are conducted exclusively through ArcStone Securities, LLC and/or Kingswood Capital Partners, LLC; “ArcStone Kingswood” itself is not a registered broker-dealer or separate legal entity.
This commentary has been prepared and published by ArcStone Financial Pulse Inc. (“ArcStone Financial Pulse”) for informational purposes only. It addresses economic, market, and asset-allocation conditions generally, and does not analyze the equity securities of any individual company. Nothing here constitutes an offer, solicitation, or recommendation to buy or sell any security, commodity, or instrument, nor investment, legal, tax, or accounting advice, and it is not tailored to the investment objectives, financial situation, or needs of any individual.
The views expressed have not been influenced by any pending or existing investment banking, advisory, or distribution relationship, and no part of any preparer's compensation is tied to the views expressed.
ArcStone Financial Pulse Inc. is affiliated with entities that provide advisory and capital markets services to issuers, including issuers in the energy and resource sectors discussed in this commentary, and those entities receive fees for those services. No ArcStone entity, affiliate, or principal holds a position in any security discussed. This commentary does not recommend, and is not intended to promote, any issuer to which ArcStone or its affiliates provide services.
This report contains forward-looking statements and forecasts (including third-party forecasts from J.P. Morgan Global Research and BlackRock as cited, and the Section 3 scenario framework, which reflects ArcStone Financial Pulse's house view, not a market-implied distribution) involving significant risk and uncertainty; actual results may differ materially. Historical data, the 1965–85 and 2015–2026 Treasury yield series and the 1971–80 and 2020–2026 gold price series, is sourced from FRED (series GS10) and the National Mining Association's gold price compilation; annual averages are computed by ArcStone Financial Pulse and presented for pattern comparison, indexed by elapsed time rather than calendar date. Past performance is not indicative of future results. Commodity and precious metals prices are volatile and subject to rapid change from factors outside ArcStone Financial Pulse's control.
Sources: Federal Reserve Board (H.15), FRED (series GS10), U.S. Treasury, CBO Long-Term Budget Outlook, OMB, National Mining Association, LBMA, ICE, ICE Data Services (CDS pricing), S&P Global Ratings, J.P. Morgan Global Research, BlackRock, U.S. EIA, and financial news services as cited throughout. Data as of July 27 to August 1, 2026 unless otherwise noted.
Revised August 2, 2026. Prior versions are superseded.
© 2026 ArcStone Financial Pulse Inc. All rights reserved. May be redistributed in full and unaltered with attribution.